With job openings, participation rate, and unemployment central to the current discourse on markets, the topic of this month’s memo is the United States labor force.
Focusing on the four largest sectors (which add up to more than 60% of payrolls and job openings in the US economy), we can see that wage inflation is a pattern that predates the onset of covid. In other words, wage inflation is not simply a result of covid supply shocks, it is based on fundamentals in the economy, and therefore it is not transitory.
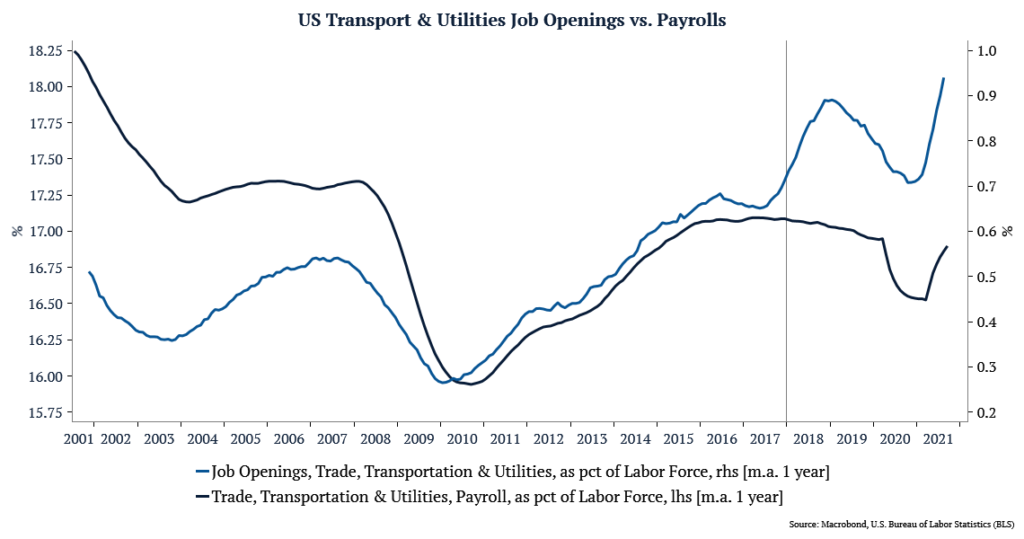
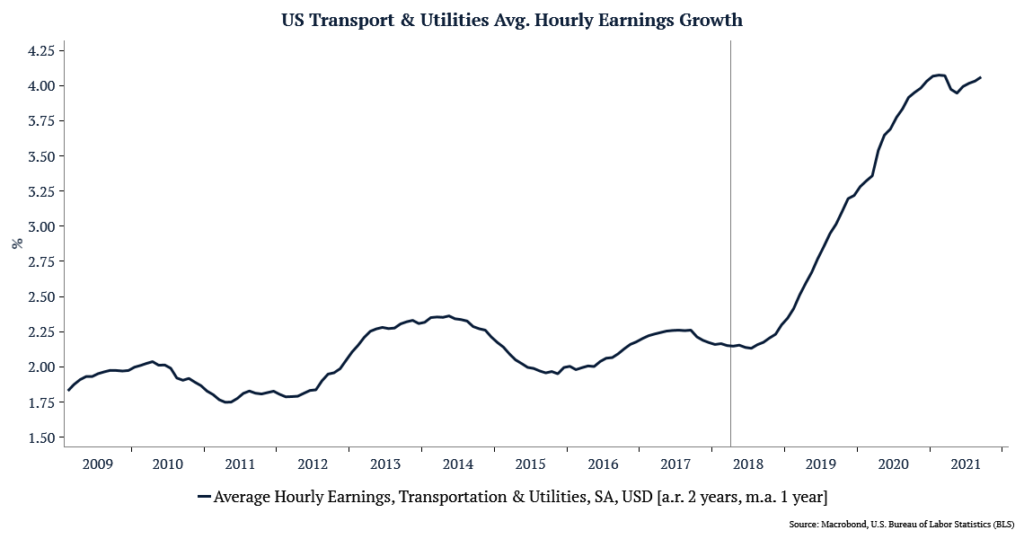
1 – Trade, Transportation & Utilities (19% of total Payrolls, 18% of total Job Openings) In 2018, demand for work (job openings) started to grow much faster than supply (using payrolls as a proxy). As a result, average hourly earnings growth for this sector has surged from an average of 2.25% percent in 2018 to over 4% today (and 3.35% pre-covid).
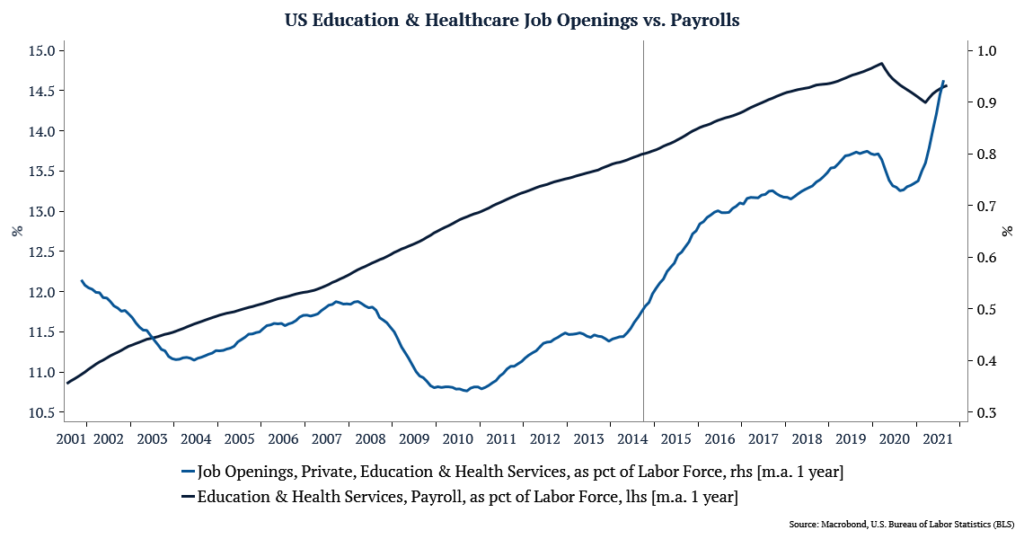
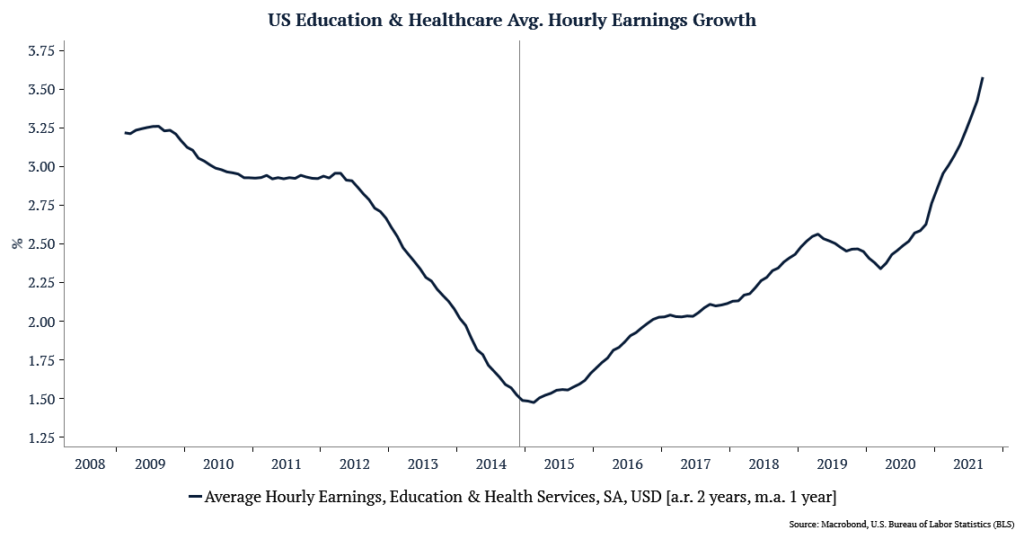
2 – Education & Health Services (16% of total Payrolls, 18% of total Job Openings) Hereto the story is very similar, but it started even earlier. In 2014, demand for work accelerated faster than supply of workers, driving an increase in earnings from 1.5% to 3.4% today (and 2.5% pre-covid).
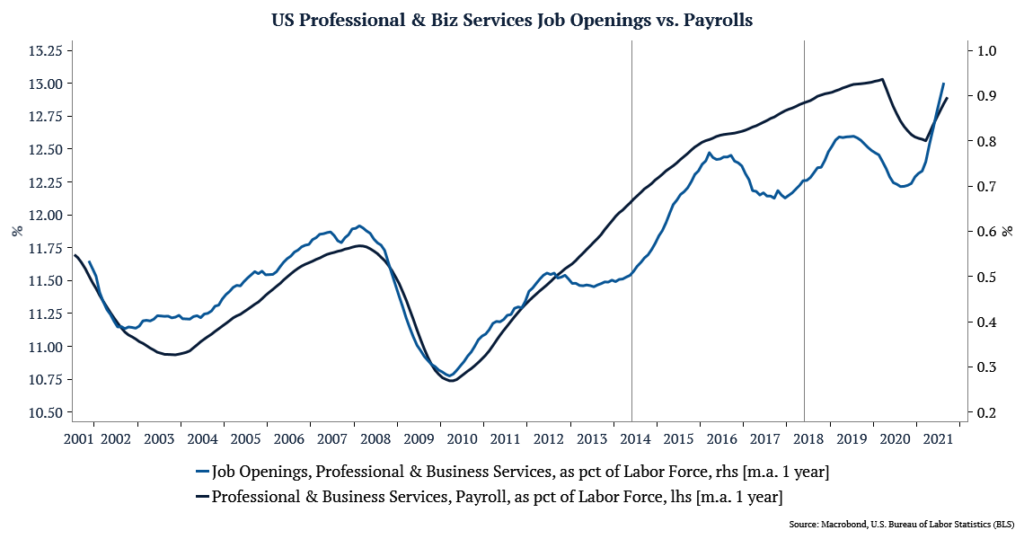
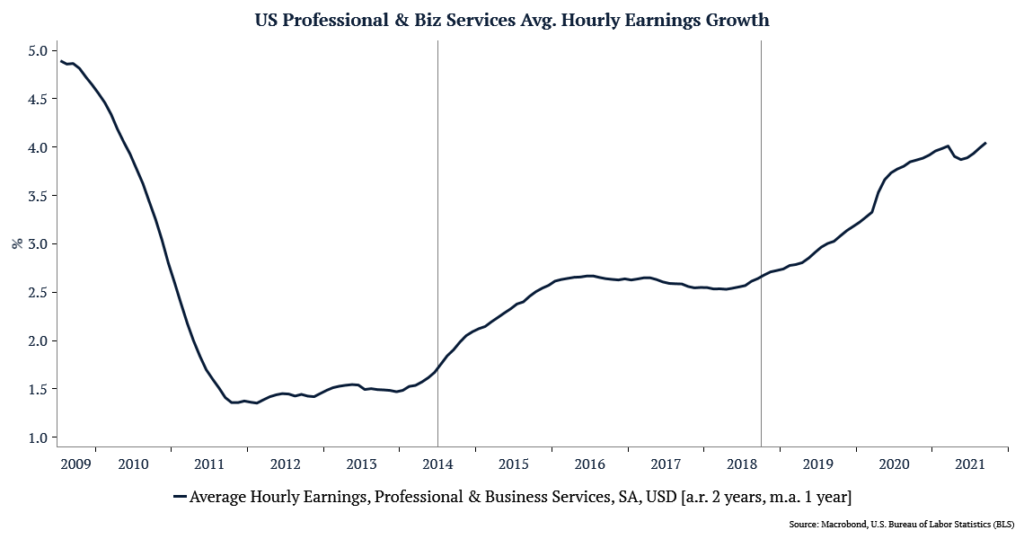
3 – Professional & Business Services (14% of total Payrolls, 18% of total Job Openings) In Professional & Business Services, we saw two waves. The first in 2014 and the second in 2018, causing an increase in earnings from 1.5% to 2.3% in the first wave, and from 2.3% to 4% today (and 3.3% pre-covid).
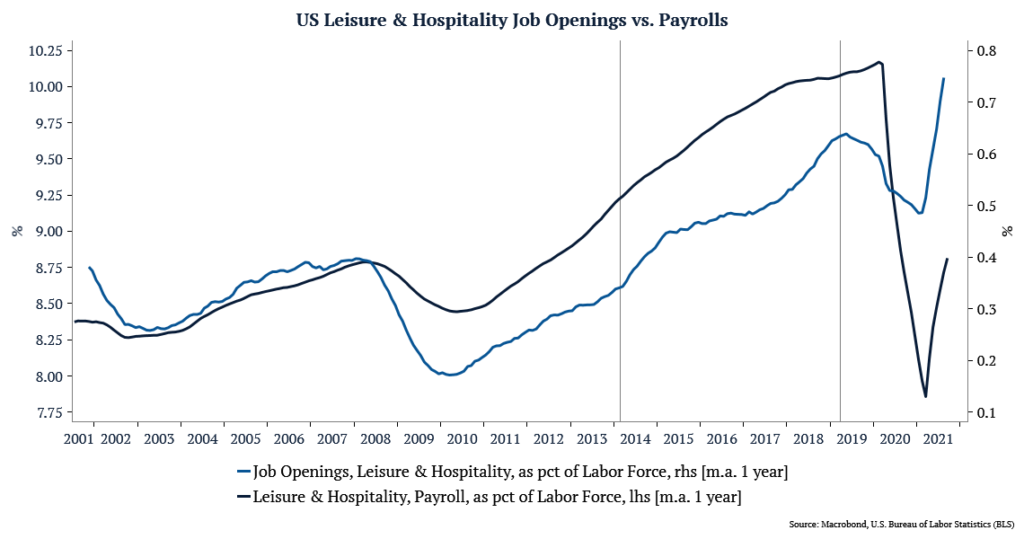
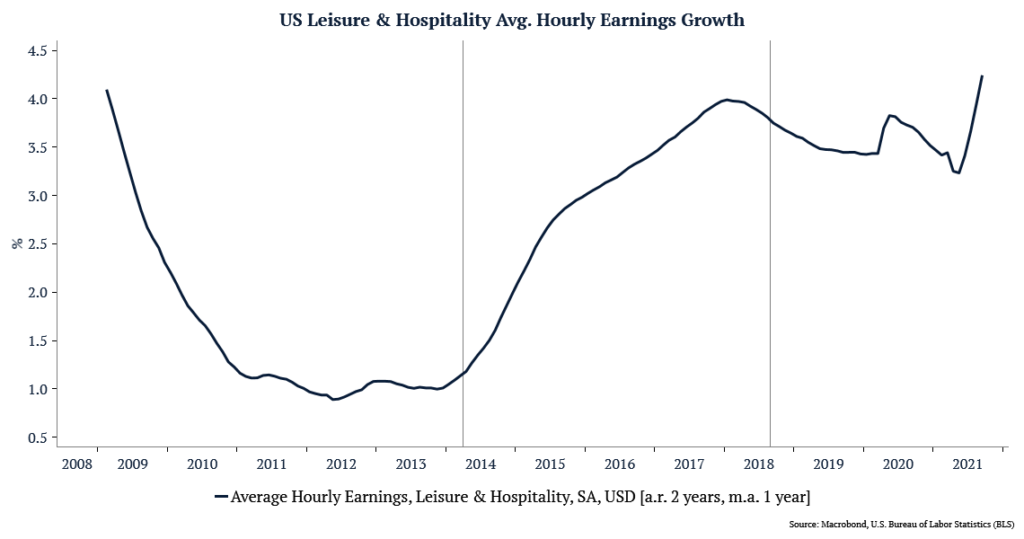
4 – Leisure & Hospitality (10% of total Payrolls, 14% of total Job Openings) Leisure & Hospitality is the only sector in the top 4 that has gone through two opposite cycles since 2014. The first was with the demand for work growing faster than supply starting in 2014, increasing earnings growth from 1% to 4% in 2017. The second cycle took place starting in 2018, with labor supply growing faster than demand, and earnings growth falling to 3.5%. Today we are back at 4% growth, last seen entering 2018. It is worth noting that today, the demand for work in this sector is at historical highs while supply is back near the levels of 2010.
Labor Supply Shock
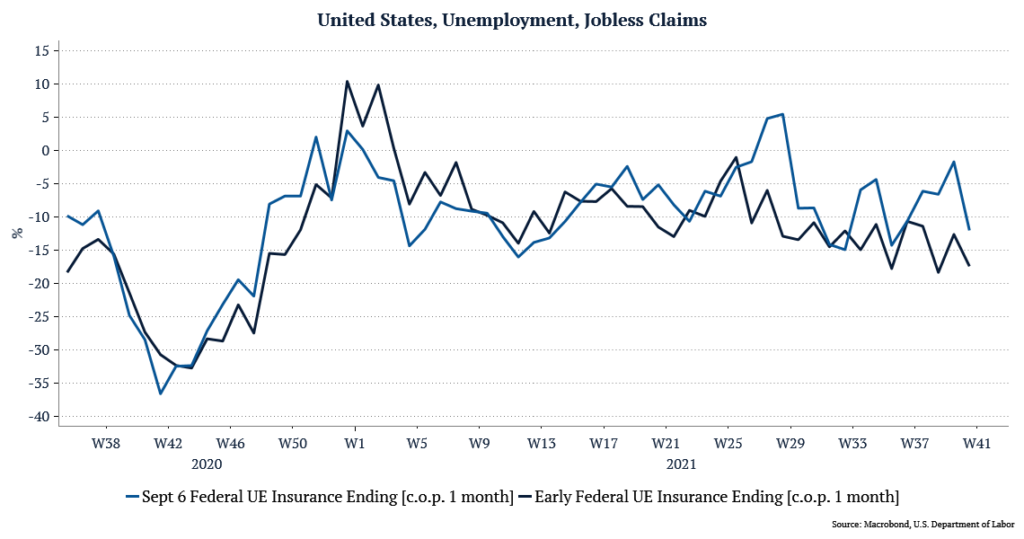
The last point has to do with the temporary labor supply shock that happened due to covid. Comparing jobless claims numbers between states that ended extra unemployment benefits before the September 6th deadline and those that adhered to the target, we see that the states that finished earlier have a much more accelerated and consistent contraction in claims across latter weeks. With this in mind, we expect some of this labor supply shock to normalize as we get farther from the deadline. However, when we look at the pre-covid trend, we believe that this will not be enough to avoid wage inflation.
